프로젝트 개요
- 본 프로젝트는 카카오클라우드 스쿨 4기에서 진행한 docker 토이 프로젝트이다
- 프로젝트 기간 : 2024.02.05 - 2024.02.13
프로젝트 주제 및 구성도
- 프로젝트 주제 : Auto Scaling 및 모니터링을 통한 Docker 컨테이너 관리 시스템
- 프로젝트 설명
• Shell 스크립트를 통해 CPU 사용량에 따라 컨테이너 스케일 자동 조정• Cadvisor, Prometheus, Grafana 를 통해 CPU 사용량 모니터링• AWX를 통해 Nginx 웹 서비스 컨테이너 배포• 새로운 이미지를 빌드하여 private repository 에 저장
- 인프라

- 프로젝트 구성도

기존의 문제점과 프로젝트로 인해 얻는 효과
- 복잡성 및 확장성 부족:
- 문제: 도커 컨테이너를 수동으로 관리하는 경우, 여러 호스트에 걸쳐 컨테이너를 배포하고 관리하기가 복잡합니다. 이로 인해 애플리케이션의 확장성이 제한될 수 있습니다.
- 개선 방안: 도커 스웜과 같은 오케스트레이션 도구를 사용하여 클러스터를 구성하고 컨테이너를 자동으로 배포 및 관리함으로써 확장성을 향상시킬 수 있습니다.
- 모니터링 부족
- 문제: 기존에는 시스템의 상태를 실시간으로 모니터링하기 위한 적절한 도구나 시스템이 부재했습니다. 이로 인해 장애 발생 시 신속한 대응이 어려웠습니다.
- 개선 방안: Prometheus와 Grafana를 활용하여 클러스터와 컨테이너의 상태를 실시간으로 모니터링하고 경고 및 경보를 설정하여 문제를 사전에 파악하고 대응할 수 있습니다.
- 보안 및 이미지 관리
- 문제: 프라이빗 레지스트리 없이 이미지를 관리하면 보안상의 위험이 있으며, 무단으로 이미지가 수정될 가능성이 있습니다.
- 개선 방안: 프라이빗 레지스트리를 구축하여 이미지를 안전하게 보호
- 자동 확장의 부재
- 문제: 트래픽이 급증할 경우 시스템이 자동으로 확장되지 않아 성능 저하나 서비스 중단이 발생할 수 있습니다.
- 개선 방안: 오토스케일링 기능을 활용
Nginx 이미지 빌드
• 디렉토리를 형성한 후 nginx 이미지를 기반으로 하는 Dockerfile을 형성한다
user1@manager:~$ mkdir nginx_maker
user1@manager:~$ cd nginx_maker/
user1@manager:~/nginx_maker$ ls
user1@manager:~/nginx_maker$ vi Dockerfile
user1@manager:~/nginx_maker$ cat Dockerfile    ##Dockerfile의 내용
FROM nginx

COPY ./html /usr/share/nginx/html

VOLUME /usr/share/nginx/html

CMD ["nginx", "-g", "daemon off;"]

user1@manager:~$ docker build -t heewon0915/toynginx .
• 현 디렉토리에 html 디렉토리를 만들고 그 안에 index.html 파일과 사용될 이미지 파일을 집어넣는다
• index.html 에는 간단한 프로젝트 구성도와 주제, 목표 등을 넣었다
<!DOCTYPE html>
<html lang="ko">
<head>
<meta charset="UTF-8">
<meta name="viewport" content="width=device-width, initial-scale=1.0">
<title>Docker container auto scaling with shell<br>&Monitoring with Grafana</title>
<style>
body {
    font-family: 'Noto Sans KR', sans-serif;
    background-color: #f2f2f2;
    margin: 0;
    padding: 0;
}

.container {
    max-width: 800px;
    margin: 20px auto;
    background-color: #fff;
    padding: 20px;
    border-radius: 10px;
    box-shadow: 0 0 10px rgba(0, 0, 0, 0.1);
}

.heading {
    text-align: center;
    margin-bottom: 20px;
}

.image-container {
    text-align: center;
    margin-bottom: 20px;
}

.image-container img {
    max-width: 100%;
    height: auto;
    border-radius: 10px;
}

section {
    margin-bottom: 30px;
    padding: 20px;
    border-radius: 10px;
}

.section-title {
    font-size: 24px;
    margin-bottom: 10px;
    color: #000; /* 검정색 */
    text-align: center;
    text-shadow: 2px 2px 4px rgba(0, 0, 0, 0.3); /* 그림자 효과 */
}

.section-content {
    font-size: 18px;
    color: #000; /* 검정색 */
    text-align: justify;
    line-height: 1.5;
    margin-top: 10px; /* 위쪽 여백 추가 */
}

/* 제목과 목표 부분의 스타일 */
.title-section, .goal-section {
    border: 4px solid #add8e6; /* 하늘색 테두리 */
    padding: 10px;
    border-radius: 10px;
}

</style>
</head>
<body>

<link href="https://fonts.googleapis.com/css2?family=Noto+Sans+KR:wght@400;700&display=swap" rel="stylesheet">

<div class="container">
    <div class="heading">
        <h1 class="title-section">Docker container auto scaling with shell<br>&Monitoring with Grafana</h1>
    </div>

    <div class="image-container">
        <img src="mainimage.jpg" alt="설계도">
    </div>

    <section class="goal-section">
        <h2 class="section-title">목표</h2>
        <p class="section-content">
            <strong>Shell 스크립트를 사용하여 Docker Container의 CPU 사용량을 모니터링하고, CPU 사용량에 따라 자동으로 Scale Out, In을 구성합니다.</strong><br><br>
            <strong>cAdvisor, Prometheus, Grafana를 활용하여 컨테이너의 CPU 사용량을 시각화하여 확인합니다.</strong><br><br>
            <strong>AWX를 활용하여 Nginx 웹 서비스 컨테이너를 배포합니다.</strong><br><br>
            <strong>Nginx 컨테이너에 사용되는 이미지를 Build하여 추가하고, 이를 Private Repository에 저장합니다.</strong>
        </p>
    </section>

</div>

</body>
</html>
Private repository 형성 및 이미지 업로드
docker container run -d -p 5000:5000 --restart=always --name registry -v /home/rapa/registry:/var/lib/registry registry

docker run -d -p 8080:8080 --name registry-web --link registry:private -e REGISTRY_URL=http://211.183.3.100:5000/v2 -e REGISTRY_NAME=211.183.3.100:5000 --restart=always hyper/docker-registry-web

docker tag heewon0915/toyimage:1.0 211.183.3.100:5000/toyimage:1.0

sudo vi /etc/docker/daemon.json

user1@manager:~$ sudo cat /etc/docker/daemon.json
{
"insecure-registries": ["211.183.3.100:5000"]
}

sudo systemctl restart docker      ##도커 재시작
docker push 211.183.3.100:5000/toyimage:1.0         ##만든 이미지를 private-repo로 push 한다
• Manager노드의 ip:8080 으로 접속하면 private-repo에 만든 이미지가 올라가있는것을 확인 할 수 있다


Prometheus, Cadvisor, Node exporter, Grafana 컨테이너 배포
docker run -d -p 9100:9100 --name node-exporter prom/node-exporter:v0.14.0

docker run --volume=/:/rootfs:ro \
 --volume=/var/run:/var/run:rw \
 --volume=/sys:/sys:ro \
 --volume=/var/lib/docker/:/var/lib/docker:ro \
 --volume=/dev/disk/:/dev/disk:ro \
 --publish=8080:8080 --detach=true \
 --name=cadvisor \
 google/cadvisor:v0.27.0

##Prometheus.yml
global:
    scrape_interval: 5s
    external_labels:
        monitor: 'my-monitor'
scrape_configs:
    - job_name: 'node-exporter'
      static_configs:
          - targets: ['211.183.3.100.101:9100', '211.183.3.100.102:9100']
##Prometheus-cadvisor.yml
global:
    scrape_interval: 5s
    external_labels:
        monitor: 'my-monitor'
scrape_configs:
    - job_name: 'node-exporter'
      static_configs:
          - targets: ['211.183.3.100.101:8080', '211.183.3.100.102:8080']
# # Prometheus for Node Exporter
docker run -d --name prometheus -h prometheus \
-v $(pwd)/prometheus.yml:/etc/prometheus/prometheus.yml \
prom/prometheus:v1.7.0 -config.file=/etc/prometheus/prometheus.yml
# # Prometheus for CAdvisor
docker run -d --name prometheus-cadvisor \
-h prometheus-cadvisor \
-v $(pwd)/prometheus-cadvisor.yml:/etc/prometheus/prometheus.yml \
prom/prometheus:v1.7.0 -config.file=/etc/prometheus/prometheus.yml
# # Grafana Container
docker run -d --name grafana -h grafana \
-e GF_SECURITY_ADMIN_PASSWORD=pass \
-p 3000:3000 --link prometheus:prometheus \
--link prometheus-cadvisor:prometheus-cadvisor \
grafana/grafana:4.4.3
AWX 컨테이너 배포
sudo curl -L "https://github.com/docker/compose/releases/download/1.29.2/docker-compose-$(uname -s)-$(uname -m)" -o /usr/local/bin/docker-compose
sudo chmod +x /usr/local/bin/docker-compose


sudo apt install -y ansible
sudo apt install -y nodejs npm
sudo npm install npm --global
sudo apt install -y python3-pip pwgen
sudo pip3 install docker-compose==1.29.2
wget https://github.com/ansible/awx/archive/17.1.0.zip
unzip 17.1.0.zip
cd awx-17.1.0/
pwgen -N 1 -s 30
ZMhJvxLuX2ljNeLrUGE3T2d44zzerH   <-- 30 자리 키 값이 출력됨
cd installer/

vi inventory
108 admin_password=test123
116 secret_key=ZMhJvxLuX2ljNeLrUGE3T2d44zzerH    <--아까 출력한 30자리 키 값을 넣는다


## 108번, 116번 줄을 다음과 같이 변경한다

sudo pip install docker==6.1.3
sudo ansible-playbook -i inventory install.yml  --> 다음을 통해 AWX를 실행한다
• admin / test123 으로 로그인 한다
AWX를 통해 nginx 컨테이너 배포하기
• Credentials에 manager를 다음과 같이 추가한다

• hosts에 manager node의 ip를 등록시킨다

• inventories에 manager를 생성하고 211.183.3.100 의 host를 등록한다

• github repo를 새로 만든 후 playbook으로 실행될 코드를 작성해서 업로드 한다

• projects에 github repo 주소를 등록하고 동기화를 통해 커밋 번호를 확인한다

• templates 를 다음과 같이 구성하고 launsh template 를 통해 실행한다

• manager 노드에서 다음과 같이 컨테이너가 배포된 것을 확인할 수 있다

• 배포될 때 사용되는 web.yml 파일이다
version: '3'
services:
  nginx:
    image: nginx
    deploy:
      replicas: 2
      resources:
        limits:
          cpus: '1'
          memory: '32M'
      placement:
        constraints: [node.role != manager]
      restart_policy:
        condition: on-failure
        max_attempts: 3
    environment:
      SERVICE_PORTS: 80
    networks:
      - web

  proxy:
    image: dockercloud/haproxy
    depends_on:
      - nginx
    volumes:
      - /var/run/docker.sock:/var/run/docker.sock
    ports:
      - 80:80
    networks:
      - web
    deploy:
      mode: global
      placement:
        constraints: [node.role == manager]

networks:
  web:
    external: true
Shell 스크립트를 사용하여 컨테이너 auto scaling하기
• 다음과 같은 키 생성을 통해 ssh 접속이 비밀번호 입력없이 가능하도록 한다
ssh-keygen -t rsa
ssh-copy-id user1@211.183.3.101
ssh user1@211.183.3.101 ## 최초 접속시에는 비밀번호 입력이 필요하니 미리 다음 명령어를 통해 접속을 시도해놓는다
• shell 스크립트 내용
#!/bin/bash
while true
do
    clear
    # 노드의 web 컨테이너 리소스 가져오기
    ssh user1@211.183.3.101 'docker stats -a --no-stream --format "{{.Name}}:{{.CPUPerc}}" | grep web' | sed 's/..$//' > test.txt && ssh user1@211.183.3.102 'docker stats -a --no-stream --format "{{.Name}}:{{.CPUPerc}}" | grep web' | sed 's/..$//' >> test.txt

    # tot에 web컨테이너 개수 저장
    tot=$(cat test.txt | grep "web" | wc -w)
    # scale 필요 시 1, pass 시 0
    check=0

    echo "==============SCALE CHECK=============="
    # test.txt에 있는 리소스 값으로 scale 지정
    for list in $(cat test.txt)
    do
        #scale cpu 기준 값
        max=40

        #한 줄씩 컨테이너 이름, cpu 리소스 불러오기
        cont_name=$(echo $list | cut -d":" -f1)
        used_cpu=$(echo $list | cut -d":" -f2)

        #소수점 제거 후 max와 비교
        for rounded_used_cpu in $(printf %.0f $used_cpu); do
            if [ "$rounded_used_cpu" -gt "$max" ]; then
                # 70 초과인 경우
                check=1
                echo $(echo $cont_name | cut -c 1-15)" CPU USE: "$rounded_used_cpu"%"
            else
                # 70 이하인 경우
                echo $(echo $cont_name | cut -c 1-15)" CPU USE: "$rounded_used_cpu"%"
            fi
        done
    done
    echo "-  -  -  -  -  -  -  -  -  -  -  -  -  "
        # scale 이 필요한 경우
        if [ $check -eq 1 ]; then
            if [ $tot -ge 10 ]; then
                echo "🔴 컨테이너가 10개 이상입니다. scale out을 하지 않습니다."
            else
                echo "🟠 scale out을 진행합니다."
                docker service scale web_nginx=$(expr $tot + 1)
            fi
        elif [ $tot -eq 2 ]; then
            echo "🟢 정상입니다."
        else
            echo "🟡 scale in을 진행합니다."
            docker service scale web_nginx=2
        fi
    echo "======================================="
    sleep 5
done
• stress를 주기 전 상태


Grafana를 통해 컨테이너의 cpu 사용량 시각화하기
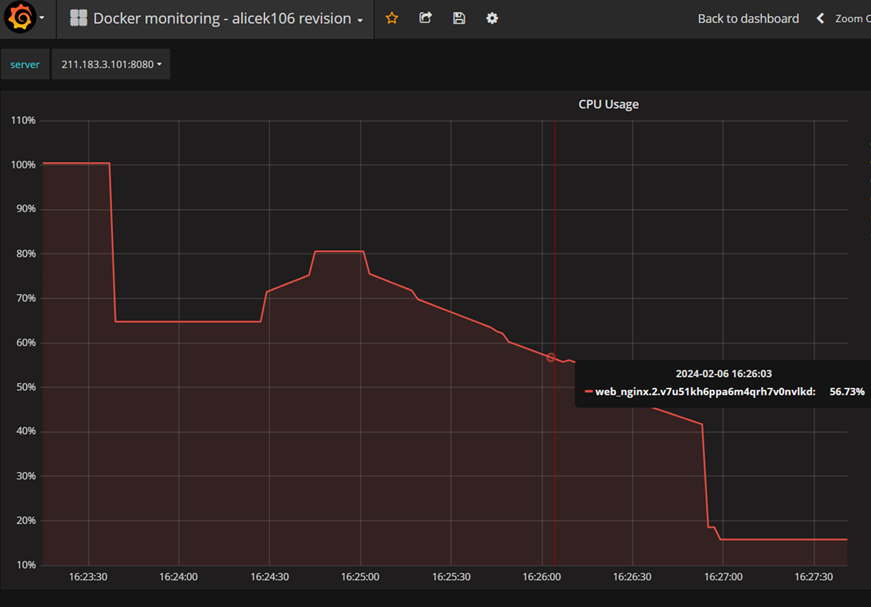
grafana 시각화하는법은 다음 블로그를 참고하였다
'클라우드' 카테고리의 다른 글
| Beats - 정의, filebeat, metricbeat (0) | 2024.02.28 |
|---|---|
| Logstash - 정의 , 플러그인의 종류 (0) | 2024.02.28 |
| Elasticsearch 집계, Query DSL (0) | 2024.01.31 |
| Elasticsearch의 내부구조, 관련용어 , mapping 타입 (0) | 2024.01.31 |
| ELK stack - elasticksearch, kibana, logstash 등 알아보기 (1) | 2024.01.21 |